




Recent Posts
 Static vs. Kinetic COF: How ASTM D1894 Testers Capture BothNov 19, 2026
 What Does an ASTM D1894 Coefficient of Friction Tester Measure?Nov 19, 2026
 ASTM F88 Seal Strength Testing: Specimens, Test Setup and ReportingNov 19, 2026
 Choosing a Seal Strength Tester: Force Range, Grips and Test SpeedNov 19, 2026
 From Slip Angle to Friction: How Inclined Plane Testing WorksNov 19, 2026

Two packaging films can begin sliding at nearly the same force yet behave differently once they are moving. The reverse can also happen: they may slide similarly after motion starts but require different forces to break free. Static and kinetic coefficients of friction capture these separate parts of the interaction, giving technical teams a more useful basis for assessing feeding, stacking, and material consistency than either value alone.
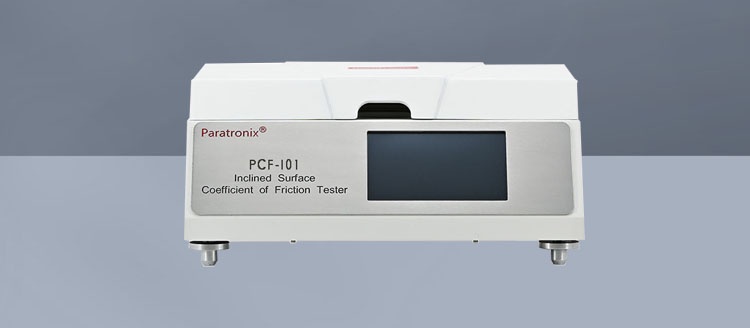
An ASTM D1894 coefficient of friction tester captures both from a force record produced as two surfaces move against one another under a defined load. The static result comes from the force associated with initiating motion; the kinetic result comes from the force during subsequent sliding. Those numbers are useful only in the context of the tested surface pair and procedure. A value measured film-to-film, for example, cannot automatically predict how the same film will behave against a metal machine component.
What static and kinetic COF tell you
The coefficient of friction, or COF, expresses the frictional force relative to the force pressing the two surfaces together. In a horizontal sled test, the normal force is approximately the weight of the sled assembly, provided the setup does not introduce significant vertical force components. COF is dimensionless: it is a ratio, not a force measurement.
Static COF describes resistance at the onset of relative motion. A higher static value indicates that more tangential force was needed to start the tested surfaces moving under the specified conditions. This can be relevant when sheets must separate from a stack or when a package first contacts a conveying surface.
Kinetic COF describes resistance after sliding has begun. It can help assess behavior during sustained transport or while a web slides over another surface. A low kinetic value may be desirable in one operation and undesirable in another: easy sliding can support movement through equipment, but insufficient resistance may also make a stack less stable.
Neither coefficient is an inherent number for a film in isolation. Each describes an interaction between two surfaces, including their finish, condition, contact history, and the conditions of the measurement. Comparing two materials without controlling those factors can produce a confident-looking difference that has little value for the intended application.
How one test captures both values
In a typical horizontal arrangement, one specimen is secured to a flat support and the other is attached to a sled. The sled provides the load pressing the surfaces together. The instrument creates relative motion between the sled and the supporting surface at a controlled rate while a force sensor records the resistance. Depending on the instrument design, the sled or the support may be driven.
At the beginning of a run, the contacting surfaces are stationary relative to each other. As the drive applies force, the recorded force rises until sliding starts. The force associated with the initial breakaway is used to calculate static COF. Once the sled is sliding, the recorded force over the applicable portion of travel is used to calculate kinetic COF.
The calculation for either value follows the same basic relationship:
COF = measured frictional force / normal force
For illustration, if the normal force is 2 N and the force used to calculate static COF is 0.6 N, the static COF is 0.30. If the force used for the kinetic calculation is 0.4 N, the kinetic COF is 0.20. These figures illustrate the calculation only; they are not acceptance limits or recommended target values.
The force trace matters because a single run contains more information than two reported numbers. A clear initial peak followed by a relatively stable sliding region is easier to interpret than a trace with several peaks, an uneven start, or pronounced fluctuations. Some variation during sliding can reflect the surface interaction, but a loose specimen, a misaligned pull, wrinkles, or vibration can also affect the record.
Not every force trace has a sharp, unambiguous breakaway peak. Very similar static and kinetic forces, a gradual transition into motion, or irregular sliding can make the start of movement difficult to identify. The instrument’s software may apply a defined method to select or calculate each result, so evaluators should understand what portion of the trace is used and how the result is determined. A numerical output alone does not establish that the underlying run was sound.
What the standard controls—and what the result still depends on
ASTM D1894 provides a standardized basis for determining static and kinetic friction of plastic film and sheeting. The applicable edition and procedure should be consulted for the prescribed apparatus, specimen preparation, conditioning, operating conditions, and calculation and reporting requirements. Those details matter when a result is used for a specification, supplier comparison, or contractual acceptance.
Within a controlled procedure, several choices still shape what the result represents:
- Surface pairing: Film against film answers a different question from film against a specified reference surface. Even in film-to-film testing, the two sides may have different treatments or finishes.
- Contact orientation: The identity of the side on the sled and the side on the support should be recorded. Reversing the arrangement can affect contact and the observed result.
- Specimen condition: Creases, contamination, damage, and handling can change the contact. Specimens should be prepared and mounted consistently, without stretching or introducing wrinkles.
- Conditioning and timing: Temperature, humidity, storage, and the interval between preparation and testing can influence some materials. Comparable results require a consistent, documented approach.
- Contact and motion conditions: Load, contact before movement, test speed, and the evaluated sliding distance affect the measurement and should follow the relevant procedure.
Film additives and surface treatments can also make the measured interaction sensitive to material history. For example, a film containing a slip additive may not present the same surface condition immediately after production as it does after storage. The direction and extent of any change depend on the material and conditions, so a comparison should use specimens with comparable histories.
This is especially important when evaluating an apparent lot-to-lot change. Before attributing a higher COF to the material formulation, check whether the tested sides, conditioning, age, specimen handling, and reference surface were comparable. If the test setup changed at the same time as the material, the two effects cannot be separated from the reported coefficients alone.
Reading the two results together
Static and kinetic COF often move in the same direction, but they need not change by the same amount. Their relationship can help frame the next investigation.
If static COF rises while kinetic COF remains similar, the difference is concentrated around the start of movement. For an operation involving repeated starts or separation from a stationary stack, that pattern may justify closer attention. If kinetic COF rises while static COF remains similar, sustained sliding resistance has changed more than breakaway resistance. A continuous transport or web-handling operation may be more sensitive to that difference.
These are diagnostic clues, not direct predictions of machine performance. Actual equipment may involve different contact surfaces, pressures, speeds, temperatures, contact times, and motion geometries. Static and kinetic measurements made under ASTM D1894 conditions can help compare materials consistently, but they do not reproduce every feature of a production line.
Stick-slip behavior is a useful example of why the force record deserves attention. If the sled alternately sticks and moves, the sliding portion of the trace may oscillate rather than settle at a nearly constant force. An average kinetic result can still describe that region as defined by the test method, but it may conceal fluctuations relevant to an application that requires smooth motion. Reviewing the trace alongside the reported value helps distinguish a stable interaction from one with similar average resistance and greater variation.
Replicates add another dimension. Two materials can have similar average coefficients but different variability between specimens. For a technical evaluator, that difference may matter when a process operates close to a feeding or handling limit. A consistent test procedure and a suitable number of specimens, selected according to the applicable method and decision, are necessary before treating observed variability as a material characteristic.
Evaluating a tester for meaningful comparisons
The first question for an instrument evaluation is whether the tester can perform the applicable ASTM D1894 procedure and produce a traceable record of how it calculated both coefficients. A display that reports “static” and “kinetic” values is useful only if the evaluator can verify the associated force data, test conditions, and calculation settings.
Force measurement capability should suit the expected resistance range. A sensor that lacks adequate resolution at low forces can make small differences difficult to assess; a setup operating outside its specified range can compromise results. Calibration and verification arrangements should cover the relevant force measurement and motion controls, with records available for the quality system using the data.
Specimen mounting is equally consequential. The sled and support should hold the material flat and securely without adding avoidable wrinkles or movement. The pulling arrangement should maintain the intended direction of force, and the operator should be able to prepare and position specimens consistently. Ease of mounting matters because inconsistent contact can introduce variation before the test begins.
For data review, look for access to the force-versus-travel or force-versus-time trace, along with the individual run results. It should be possible to see the initial peak, inspect the sliding region, identify irregular runs, and retain the conditions associated with each result. When different laboratories or instruments are being compared, align the method edition, surface pairing, specimen history, and calculation settings before interpreting small numerical differences.
The most defensible specification connects the measurement to the handling problem it is intended to control. Define the surfaces and test conditions first, then establish how static and kinetic results relate to acceptable material behavior. That gives each coefficient a clear purpose and makes an unexpected result easier to investigate.
Leave A Reply
Search by Keywords