




Recent Posts
 Heat Seal Tester vs Hot Tack Tester: Which ASTM Standards Apply?Oct 24, 2026
 Gas Permeability Testing: Differential or Equal Pressure?Oct 24, 2026
 ISO 9187 and Ampoule Break Force Testing: Which Requirements Apply?Oct 24, 2026
 What does a syringe needle puncture tester measure during insertion?Oct 24, 2026
 What does ASTM F543 require of a bone screw torque tester?Oct 23, 2026

What does a syringe needle puncture tester measure during insertion?
A syringe needle puncture tester measures the force required to push a needle into a specified test material. Rather than producing only a single “sharpness” number, it records how resistance changes as the needle advances. The resulting force–displacement curve can show loading before breakthrough, the force associated with puncture, and resistance during continued insertion.
These measurements help researchers and quality teams compare needle designs, investigate manufacturing variation, and assess whether a change in tip geometry or lubrication affects insertion behavior. But the curve is not a direct reading of pain, and the highest force is not automatically the force at which the tip first punctures the material. Understanding those distinctions is essential before comparing results.
The instrument measures axial force against needle travel
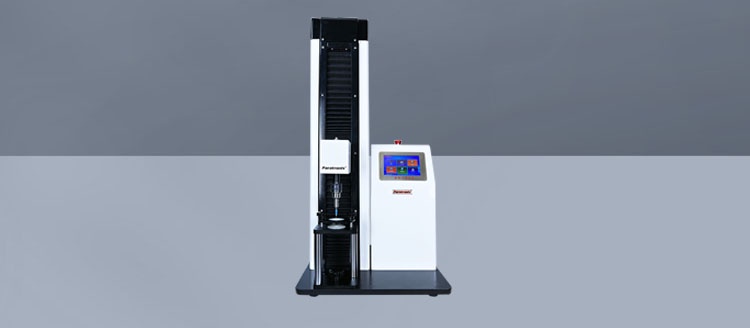
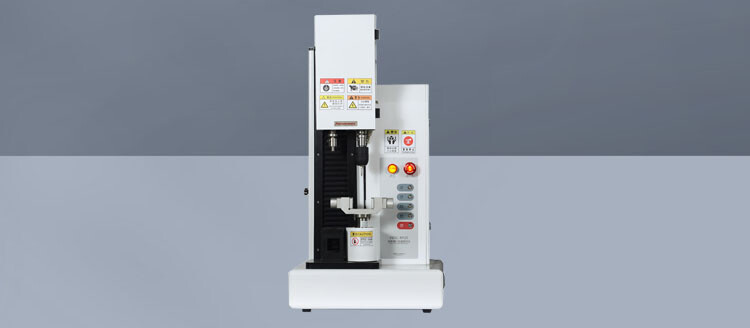
In a typical setup, a needle is held in a fixture and driven toward a supported test specimen at a controlled speed. A load cell measures force along the test axis while the instrument records travel. Force is commonly reported in newtons, and displacement in millimeters. Some systems also display force against time, although displacement is generally more useful for relating a feature on the curve to a stage of insertion.
There is an important measurement detail here: machine travel is not necessarily the same as true penetration depth. Before puncture, the material may stretch or deflect while the needle tip remains against its surface. Fixture compliance and needle bending can also contribute to recorded movement. Unless the setup accounts for those effects, the horizontal axis should be interpreted as measured travel, not exact depth inside the material.
The tester therefore measures the response of a complete test system: needle, specimen, fixture, and motion conditions. Calling the result “needle sharpness” is convenient, but it leaves out much of what determines the reading.
Reading the insertion curve without oversimplifying it
Contact and loading before puncture
As the tip contacts the specimen, force begins to rise. The material may deform substantially before it breaks. This loading region reflects both the interaction at the needle tip and the stiffness of the supported specimen. A tightly supported film and a flexible membrane spanning an opening can produce different traces even when tested with the same needle.
The point selected as “initial contact” also affects displacement-based results. A force threshold used to identify contact must be defined consistently; otherwise, apparent differences in travel to puncture may come from data processing rather than needle behavior.
Breakthrough and peak penetration force
Puncture often produces a local force maximum followed by a drop as the material yields or tears. Under a defined method, that feature can be used to identify puncture force. However, the largest force anywhere in the insertion cycle may occur later, particularly while more of the bevel enters or the shaft interacts with the specimen.
This is why a report should distinguish the force associated with initial breakthrough from the maximum force over a specified insertion interval. If software reports only “peak force,” check exactly where it searches for that peak. Two laboratories can obtain different reported values from similar curves simply because their analysis windows differ.
Resistance after the tip has entered
Once the tip penetrates, resistance does not disappear. Continued movement may involve further cutting, material deformation, and friction against the bevel and shaft. This part of the trace is often described as insertion drag or sliding resistance, but it should not automatically be treated as pure friction.
For comparisons, an average force over a clearly defined post-puncture interval may be more informative than a single maximum. A needle might show a relatively low breakthrough force yet higher resistance afterward. That pattern raises different questions from a needle with a high initial peak and comparatively smooth continued travel.
Work of insertion, when the method calls for it
Software may calculate the area under the force–displacement curve over a selected interval. This represents mechanical work over that interval and captures more of the insertion event than a peak alone. Its usefulness depends on consistent integration boundaries and an appropriate interpretation of displacement. If recorded travel includes substantial specimen deflection, the value includes work associated with that deformation, not just cutting or sliding.
Why the same needle can produce different results
Test material is often the first variable to investigate when results disagree. Polymer films, elastomeric sheets, and biological tissues differ in stiffness, tearing behavior, thickness, and surface interaction. A reference material can support repeatable comparisons without reproducing every feature of skin or a pharmaceutical closure.
Even specimens carrying the same material description may differ by batch, storage history, or conditioning. Thickness and clamping tension deserve particular attention. A change in the unsupported opening beneath a specimen can change how far it deflects before puncture, altering both the curve shape and the measured force.
Insertion speed matters because many test materials respond differently at different loading rates. It is not safe to assume that faster insertion will always increase or decrease force; the outcome depends on the material and the interaction being measured. Comparisons need the same defined speed and a motion profile that does not introduce acceleration effects into the measurement region.
Alignment is equally practical. An off-axis needle can bend, contact the material unevenly, or introduce forces that the axial reading does not fully describe. Needle projection from the holder also affects bending susceptibility. Changing fixtures without controlling exposed needle length can therefore undermine an otherwise careful comparison.
For a repeatable method, document at least:
- Specimen identity, thickness, conditioning, support geometry, and clamping arrangement.
- Needle dimensions, orientation, exposed length, and whether each needle is previously unused.
- Insertion speed, travel limit, contact definition, and force-analysis intervals.
- Load-cell range, acquisition settings, and any filtering applied to the signal.
What the results can tell a quality team—and what they cannot
Consider a comparison between two needle lots tested with fresh specimens under the same conditions. If one lot consistently shows a higher breakthrough peak, that is a reason to investigate tip geometry, edge condition, or other manufacturing differences. It is not proof of a particular defect. Microscopic examination and production records may be needed to explain the force change.
If breakthrough remains similar but post-puncture resistance increases, surface condition or lubrication may deserve attention. Again, the trace helps direct the investigation; it does not identify the cause by itself. Specimen variation, alignment, and fixture contamination should be ruled out before attributing the difference to the needles.
Repeated measurements matter because a single favorable trace says little about manufacturing consistency. Teams should examine the distribution of results and unusual curve shapes, not just the average peak. Sample size and acceptance criteria need to follow the applicable method, product requirements, and purpose of the study rather than an arbitrary universal limit.
A syringe needle puncture tester does not directly measure patient pain, injection flow, needle strength, or closure integrity. Lower insertion force in a reference material may support a comparative mechanical assessment, but a claim about comfort requires additional evidence. Likewise, puncturing an elastomeric closure does not establish its resealing performance, fragmentation behavior, or resistance to leakage.
Match the equipment to the force event, not just the maximum capacity
When evaluating equipment, start with the expected force range and the shortest event that needs to be resolved. A machine with ample capacity may still be unsuitable if its measurement performance at low forces is inadequate. Display resolution alone does not establish accuracy, and a brief puncture peak can be missed or distorted if acquisition and filtering settings are inappropriate.
Useful questions include whether the instrument exports the full force–displacement trace, allows clearly defined analysis intervals, and holds the specimen without slipping. For comparative work, these capabilities can matter more than the number of preconfigured calculations. Force calibration should be current, while speed and displacement performance should be verified as required by the method.
Paratronix Instruments Co., Ltd. develops and manufactures packaging testing instruments for pharmaceutical packaging, plastics, and high-barrier materials. In that broader testing context, it is particularly important to separate a needle-penetration question from a package-performance question. Similar-looking puncture operations can require different fixtures, specimens, and result definitions; the test objective should guide the equipment discussion.
Before accepting a reported “puncture force,” ask to see the curve and the method behind it. Identify where contact begins, which peak is being reported, and what happens after breakthrough. If those points are clear—and specimen support, speed, and alignment are controlled—the measurement becomes a useful basis for comparison rather than an isolated number.
Leave A Reply
Search by Keywords